E3CI Datastation

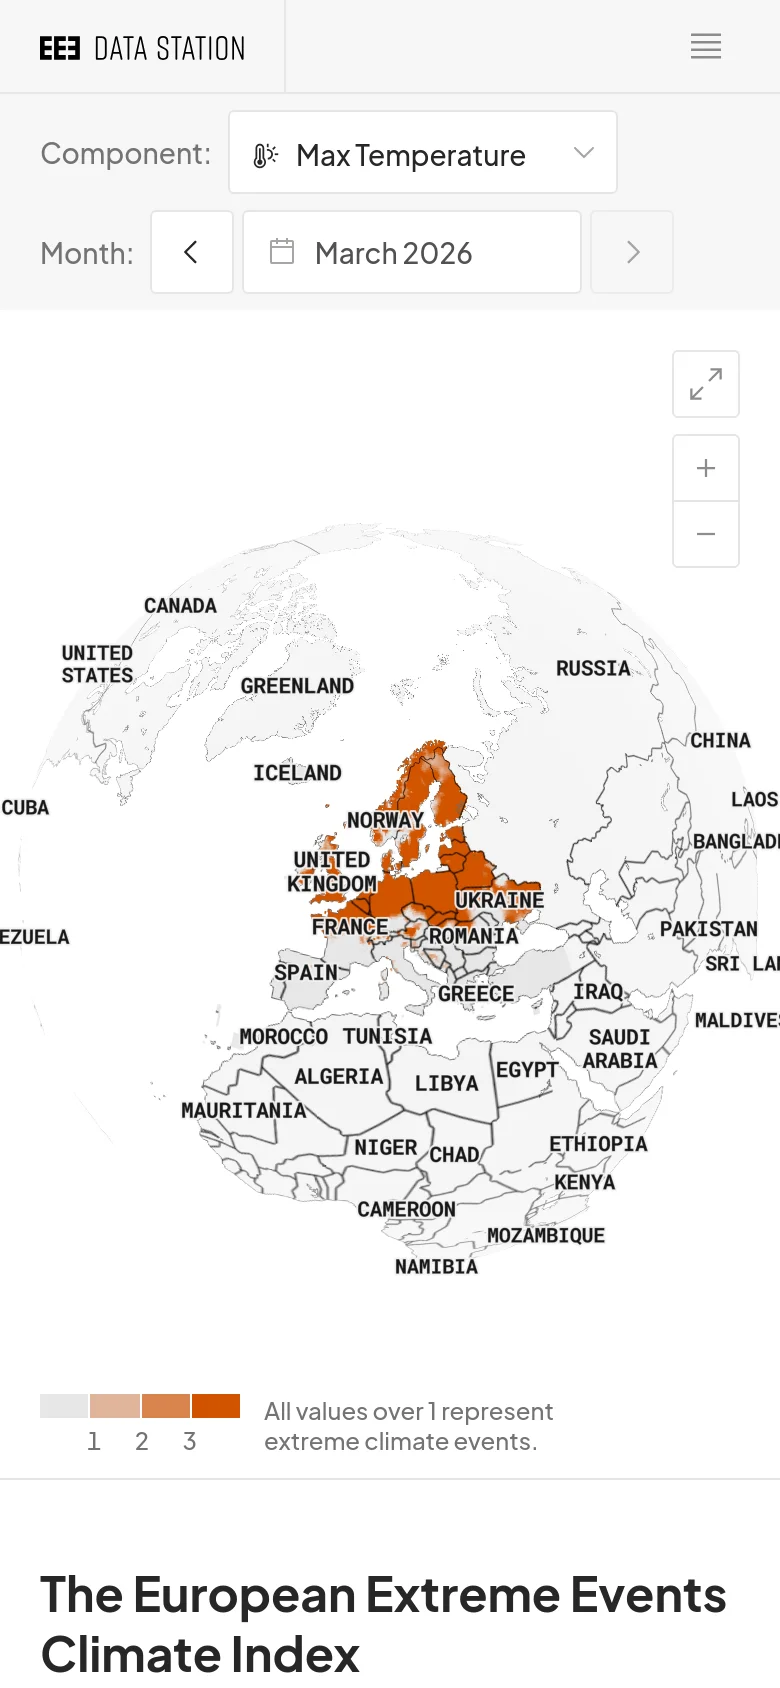
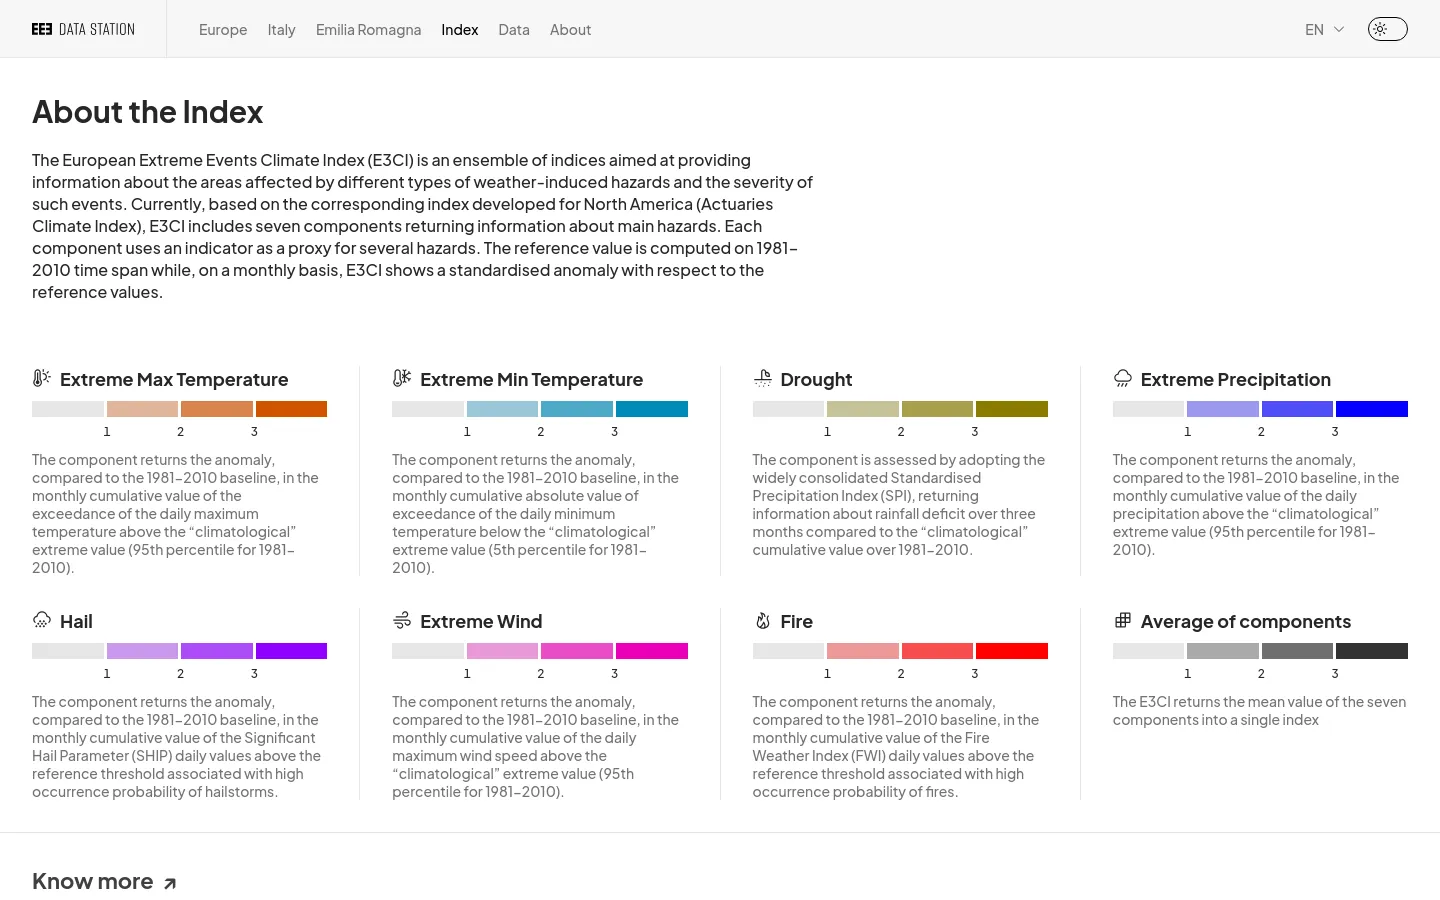
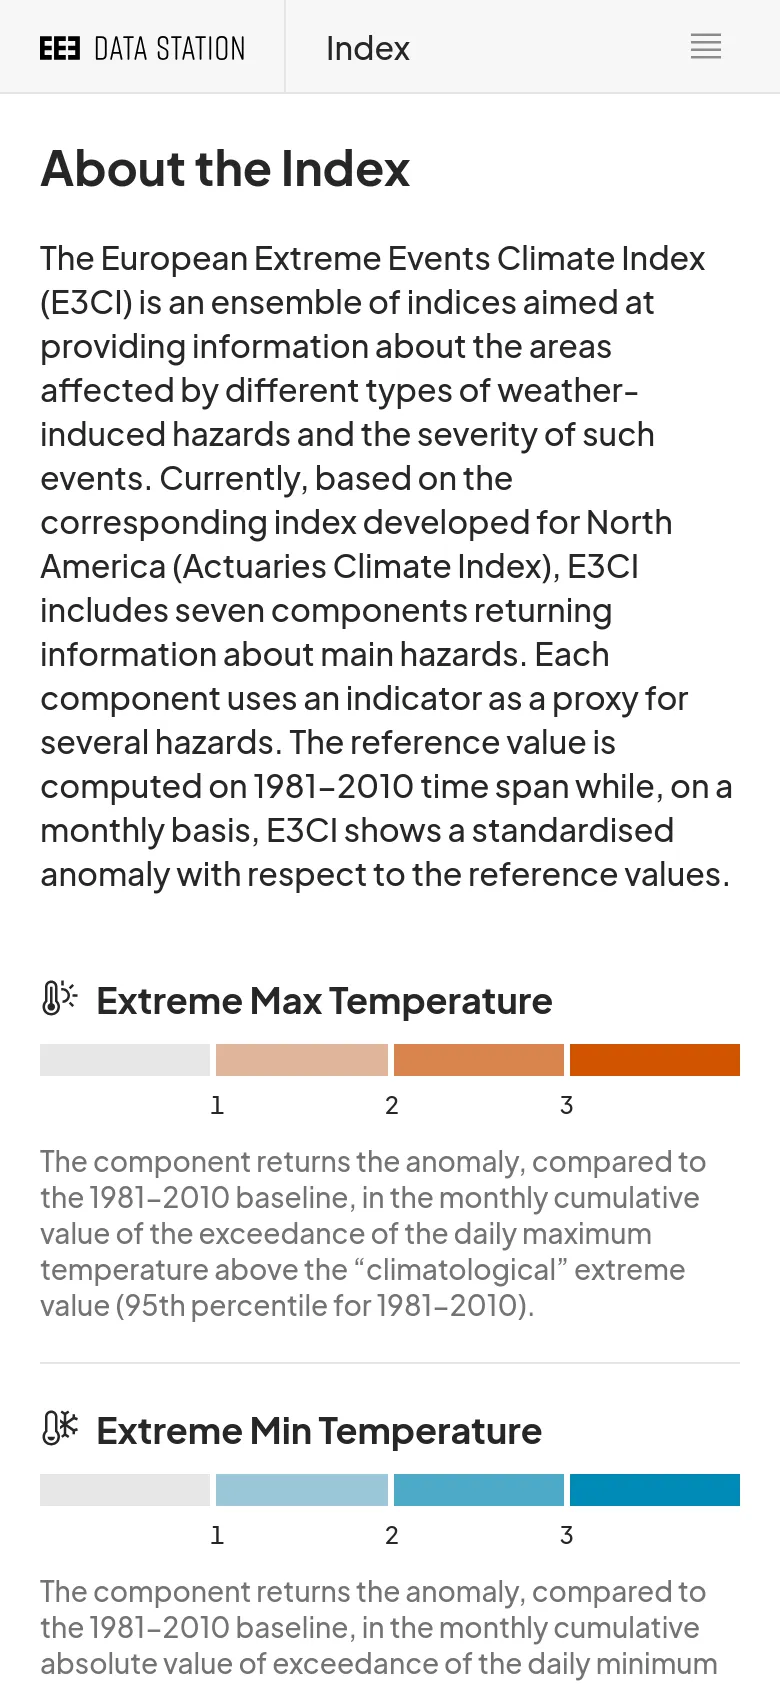
E3CI Datastation serves as a sophisticated scientific dashboard designed to monitor and visualize weather-induced hazards across Europe. By synthesizing complex data components—including temperature extremes, drought, precipitation, hail, fire, and wind—the platform provides a critical overview of climate volatility. It functions as an essential tool for researchers, policymakers, and environmental analysts seeking to understand the severity and geographical distribution of extreme climate events. The visual identity is defined by a clean, utilitarian, and highly functional aesthetic that prioritizes data clarity above all else. Utilizing a minimalist layout with a neutral color palette, the interface allows the high-contrast heat maps and data grids to command attention. The design language is professional and academic, employing a structured typographic hierarchy and intuitive interactive elements like map controls and dropdown filters to facilitate seamless data exploration.
- Cinzia Bongino — designer
- UPCLOSE — developer
Design


Technology
- jsDelivr
- Nginx
- Nginx
- Nuxt.js


